


Clinical Pearls
“Data & Variables – The Chi of the martial art of statistics”
Following the introduction to statistics in the previous issue, let us start getting trained in this martial art of medicine. The concept of statistics is pillared on data and variables – can be called ‘the Chi’ of this martial art. To decipher the complexity of statistics later, we need to start with understanding data.
In this write-up, we will first understand the concept and source of data followed by the classification of data with methods to represent data and the application of this knowledge.
What Is Data?: Definition
Data is a measurement or observation. This measurement and observation must be named and the name we give is ‘variable.’ For example, blood pressure measurement taken from patients is a variable that gets a value when creating data.
From Where Does Data Emerge?: Source of Data
Before we venture into the classification of data, let us take a look at the source of data. As we know, the target of any research is a population and, at the same time, it is difficult to consider the total population for any kind of research. For this reason, we use a representative sample and extrapolate the findings to the population with the help of statistical methods. Figure 1 describes the cycle of data. Here population data is dealt with by descriptive statistics, and the data on the representative population is dealt with by inferential statistics. “Oh, so whatever I have done sitting in a hospital is inferential statistics ?”
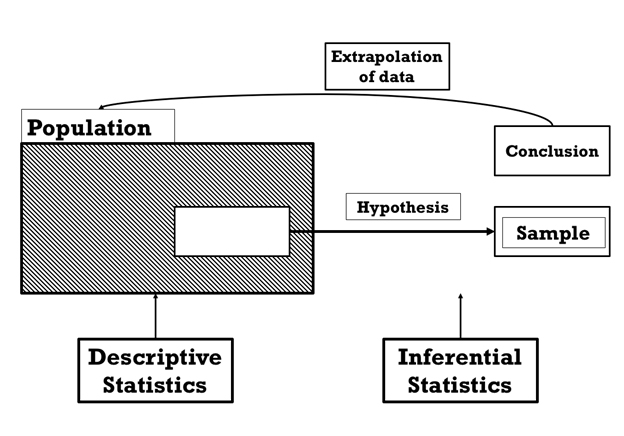
Figure 1: Source of data in statistics.
How Do We Classify Data?: Classification
There are various ways to categorize these variables: some variables are qualitative and others quantitative (Figure 2). Qualitative data can be further categorized to nominal and ordinal. When data are unordered, such as blood group, gender, the region the person stays, it is known as nominal data and if the data follow some order, categories with unequal difference between categories, it is considered as ordinal data. Examples of ordinal data include the power of muscles, severity of dyspnea, stage of cancer. As these qualitative variables point out the category, they are called categorical variables too.
Data is a measurement or observation. This measurement and observation must be named and the name we give is ‘variable.’ For example, blood pressure measurement taken from patients is a variable that gets a value when creating data.
Coming to quantitative data, the division follows either the interval or the ratio. Temperature recordings are the best way to understand interval data: the difference between any two values on a scale is equal, but zero is an undefined point. The difference between the temperature in Fahrenheit 80 and 100 is the same as the difference between 70 and 90. But a temperature reading of 100 is not in true sense a double of 50. In short, we cannot take a meaningful ratio of this variable. The ratio variable is the same as the interval, but here zero has a true sense. Height, weight, and many laboratory measurements are examples of ratios.
Data is a measurement or observation. This measurement and observation must be named and the name we give is ‘variable.’ For example, blood pressure measurement taken from patients is a variable that gets a value when creating data.
While reading randomized control trials, we come across terms such as dependent and independent variables. Here the outcomes of interest become the dependent variables and the intervention and the other factors influencing outcomes are independent variables.
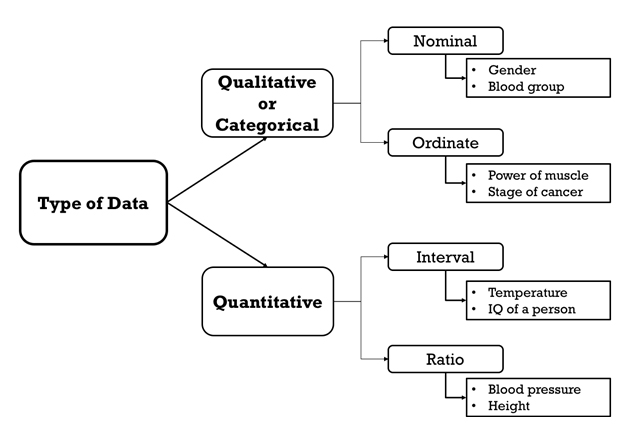
Figure 2: Classification of data.
How Do We Represent Data?
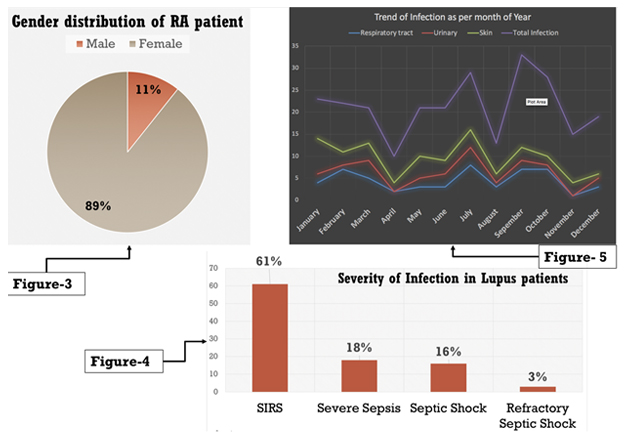
For categorical data, the best way of representation would be a pie chart, which compares frequency as proportions, e.g. gender can be best presented with a pie chart (Figure 3). To display the frequency distribution of nominal and ordinal data, bar charts are preferred. The bars are separated with gaps of equal sizes, in descending order from left to right (Figure 4). When data are quantitative, i.e. when values are continuous, a histogram is preferred. When one wants to compare the relationship between two continuous variables or the ‘trend,’ a line graph is the method of choice (Figure 5).
Distribution of Data
When data are categorical or qualitative, non-parametric methods of statistics are used for analyses and interpretation; but when data are quantitative, one needs to decide the distribution of data to choose the appropriate statistical test. A normal distribution is a bell-shaped symmetrical curve in which the mean, median, and mode coincide, as 50% of the values are above the mean and most of the values are close to the mean. Data that do not follow this distribution are skewed data; such data can be either positively skewed (mode to mean direction is positive) or negatively skewed (the direction of mode to mean is toward negative on the histogram). There are various statistical methods in SPSS to decipher the distribution of data, e.g. the Shapiro–Wilk test is the most powerful and the Kolmogorov–Smirnov (K–S) test the least powerful. Thus this step guides us in choosing the appropriate statistical method as per our data distribution. The most commonly used parametric tests applied to normally distributed data include the z-test, Student’s t-test, ANOVA, and correlation and regression. Examples of non-parametric tests include Mann–Whitney U, Wilcoxon signed-rank test, and Spearman’s Rank test. We will discuss these in the upcoming issues.
Application and Conclusion
“A 43-year–old lady presented with severe pain in multiple joints with morning stiffness of 60 minutes’ duration for the last six months. On examination, her temperature was 37.8°C and blood pressure 126/80 mmHg.”
Let us categorize this data:
2. Lady=gender=nominal variable
3. Severe category of pain=ordinal variable
4. Morning stiffness of 60 minutes=ratio variable
5. Temperature 37.8°C=interval variable
6. Blood pressure=ratio variable
For analyzing 2 and 3, we would use a non-parametric test, as they are categorical or qualitative variables. For analyzing 1, 4, 5, and 6, we need to check the distribution with a histogram and either the Shapiro–Wilk test or Kolmogorov–Smirnov (K–S) test and then apply the appropriate statistical method.
Thus we now know how we deal with inferential statistics in a hospital setup. Knowing the type of data and the distribution of data helps us decide the appropriate representation method and the appropriate statistical method to be applied. In the next issue, we will discuss the concept of sample size, which has remained an ever-burning question to researchers, especially students submitting a research protocol.

Sanket Shah, DM resident, JIMPER